Electric Vehicle Powertrain - Calculations and Mathematical Modelling
All about Powertrain
Powertrain is a crucial component in any vehicle. In this blog we will talk about electric powertrain design. Everything will be seen in the perspective of E2W on asphalt. We will also see a case study of ATHER 450X, A beast work of electric powertrain by Ather Energy.
Longitudinal Forces acting on a vehicle:

Source:https://drive.google.com/file/d/17VwUjuRfPLB-W0KXfy3djaeNOFBNMRe2/view?usp=sharing
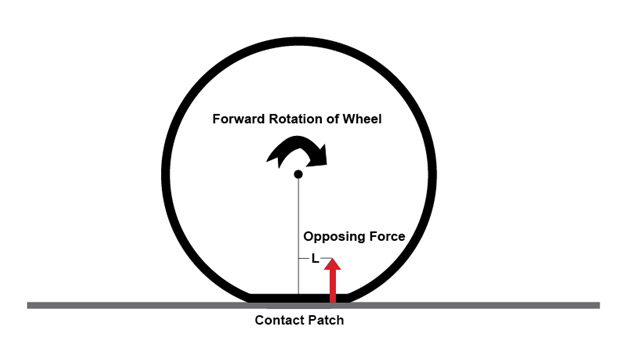
Rolling Resistance:
A force that opposes the motion of an object. This is the force acting on the vehicle due to tire properties called hysteresis.


Source: https://www.bikesmedia.in/uploads/image/reviews/2016/nov/rolling-resistance-motorcycle-tyres.jpg
Due to hysteresis, the tire patch on the leading edge has more contact than the trailing edge (The contact is less at trailing edge due to slow retraction of tire to no load state). This causes a moment opposing the direction of motion. This opposing moment is defined as rolling resistance.
For most two wheelers and 4 wheelers on asphalt, the coefficient of rolling resistance is considered to be 0.015.

More on rolling resistance coefficients: https://www.engineeringtoolbox.com/rolling-friction-resistance-d_1303.html
Drag/Aerodynamic Resistance:
This force opposes the vehicle motion due to atmospheric air. This force plays a crucial role at higher velocities (>40 kmph).
Aerodynamic coefficient and frontal surface area play a crucial role in drag resistance. A sedan has less drag coefficient (<0.3) than a two-wheeler (approximately 0.9 – 1.1). This is due to the turbulence created by the human body in case of a two-wheeler where the human body exposed to air disturbs the air flow causing turbulence and low-pressure regions behind the human body resulting in vehicle energy loss. In the case of a 4-wheeler, the human body is completely surrounded by streamlined body panels which disturbs the air creating less turbulence and therefore less energy loss.
Visit https://www.engineeringtoolbox.com/drag-coefficient-d_627.html for drag coefficient of various vehicle sectors.

Gradient Resistance:
The resistance offered during an inclination climb due to gravity.

Acceleration Force:
The force required by the vehicle to accelerate from certain velocity to higher velocity at a given time.

m – mass of the vehicle + rider (kg)
a – acceleration of the vehicle (m/s2 )
Vf – Final Velocity (for acceleration not top speed)
Vi -Initial velocity (mostly 0 m/s2 )
t – time in sec
Is it good to consider Constant linear acceleration??
Let’s consider a Two-wheeler to achieve 0 – 40 kmph in 3.3 Sec, what is the acceleration force and power required?
Case 1: Constant Linear acceleration, Case 2: Stepped acceleration


It can be seen that a two-stage acceleration consumes less power than a linear constant acceleration. This is because power is a function of force and velocity. At time T, the velocity is 40 kmph, in case of linear acceleration the force required is more when compared to step acceleration. Therefore, less power is consumed in step acceleration.
Approach 1: Peak parameters Calculations:
This approach is used for peak torque and peak power calculations, for simulation purposes approach 2 is used.
Total Tractive Effort (Required):
Total Tractive Force = Rolling Resistance + Drag Resistance + Gradient Resistance + Acceleration Force
This is the total force that is required to move the vehicle at described acceleration. The motor has to provide the calculated total tractive effort at wheels for required performance.
Torque Calculation based on required Tractive Effort:
Torque =Total Tractive Effort (N)*Tire Radius (m)
So, the applied tractive effort force is multiplied with tire radius to yield us the wheel torque (Nm). Based on the motor availability and feasibility, a proper gear reduction is selected by dividing the wheel torque to the motor torque
Gear Ratio = Wheel Torque / Motor Torque
Top speed Calculation:
Top speed of the vehicle is decided by the motor rpm and gear reduction used. For a particular tire size, the wheel velocity (rpm) can be derived using,

The Gear Ratio is needed to reduce the motor rpm, as the motor rpm is always greater than wheel rpm. Usually, peak motor speed is chosen. For an electric motor it can be anywhere from 4000 – 13000 (ideal cases), but the wheel speed is in the range of (900 – 1100 RPM) for 100 Kmph.
Therefore,
Gear Ratio = Motor Speed (RPM) / Wheel Speed (RPM)
Peak Power Calculation:
The power is a function of velocity and force. The power is calculated at two stages, Peak torque based on acceleration and top speed.
At peak torque based on acceleration, Power = Total Tractive effort*final velocity (during acceleration)
Top speed, Power = (Rolling Resistance Force + Drag Resistance at top speed) *Top speed (m/s)
Whichever is greater is chosen as peak power for the motor.
Conclusion:
Now we have two gear ratios for the same vehicle. The powertrain engineer has to find the optimum gear ratio for better performance. In an electric vehicle (especially two wheelers) there is no gear box or variable transmission as the torque characteristics match with an ICE with a gear box.
This above calculation will freeze the peak parameters such as peak motor torque, peak motor RPM, peak motor power and reduction ratio. With this we can start looking for motor vendors. Once we find a motor vendor of our choice, we can get the torque characteristics of the motor and do a dynamic simulation, which is approach 2.
Approach 2: Dynamic Calculations (For simulations):
The workflow of simulation is:

Wheel torque = Motor torque*Reduction ratio
Wheel Torque/ Tire radius = Tractive Force produced
In this case,
Tractive force required (F_reqd) = Rolling Resistance + Drag Resistance + Gradient Resistance

The above equations when put together in a simulation environment like MATLAB Simulink can help us understand the dynamic behavior of a vehicle at various time intervals, throttle percentage and so on.
Ather 450X Powertrain case study:
Ather 450X has best engineered its vehicle as well as the powertrain when compared to other scooters on the EV segment especially in India. The data shown here are collected from internet resources and self-manipulated. No data was being leaked/ Exposed from official Ather Energy.
Let’s talk about their specs:

Source: https://evreporter.com/ather-450x/
Powertrain Calculations:
Approach 1: Peak parameters Calculations:


Approach 2: Dynamic Calculations (For simulations):
Motor Characteristics:
Let’s talk about the motor. It is a 26Nm peak torque, 6kW peak power PMSM motor. Many pictures suggest that the motor is made by MAHLE/BOSCH. Using the torque, power, top speed and reduction ratio (7.8) from the Ather energy official page, the following torque characteristics curve of the motor was derived. The data used throughout are self-manipulated and some are taken from Ather official webpage.


MATLAB Simulation:

Above is the MATLAB Simulink environment simulation. I'll go through each block:
Throttle input:
The throttle input is between 0 – 1. At 1, the vehicle is at full throttle, so a clear performance of the vehicle can be seen (especially straight-line acceleration and top speed). It also has a PID controller that will output throttle to the motor based on a steady input speed. This is used for range estimation.
AT switch cmd = 1; full throttle
AT switch cmd = -1; Steady velocity throttle (based on what is set at ref. velocity)
Motor Power Generation:
This block outputs the motor torque as a function of motor RPM and throttle command. The relation between torque and RPM is set as a lookup table from the torque characteristic curve. The motor torque is then multiplied with the throttle cmd (0 -1) to get the torque value as a function of throttle cmd. It also gives us mechanical and electrical power output. The electrical power output is calculated based on the efficiency curve of the motor (not done in this simulation as we do not have efficiency curve for Ather 450X motor, instead we assumed a constant efficiency loss).
Gearbox:
In this block the motor torque is multiplied with gear reduction and overall drivetrain efficiency to get the wheel torque.
Vehicle Body:
In this block, the wheel torque is converted to wheel force by dividing with the wheel radius (m). Then the tractive forces are calculated based on the velocity and gradient angles. This both are subtracted and divided by the weight of vehicle + driver to get the acceleration. The acceleration is further integrated to get the velocity of the vehicle (m/s).
Velocity conversion:
The vehicle velocity is here converted to wheel speed using ((60*V) / (pi*D)) = N (wheel), This is then multiplied with reduction ratio to get motor RPM.
Conclusion:
I ran the simulation for Ather 450X and compared it with real-time data and here is the result.

The real-time data was collected from the video: https://www.youtube.com/watch?v=ZLbm2TDE3JM&t=155s&ab_channel=ExpressDrives
The result shows a correlation (R2) = 0.992 which is really great. After 20 seconds they will reach a steady state velocity of 82 kmph.
The MATLAB Simulink file is attached here.
Please support my MathWorks community page. All the simulation and experimental data are attached.
Conclusion:
I hope this blog helps you understand the workflow of how a powertrain design is done and simulated. If you find any mistake or suggestions kindly do comment. Also comment your doubts, queries. You can refer to the document at resource 3 for better understanding of vehicle modelling.
Resources:
https://www.youtube.com/playlist?list=PLyqSpQzTE6M9spod-UH7Q69wQ3uRm5thr
https://www.youtube.com/watch?v=J-JOn5xaZbQ&t=910s&ab_channel=MATLAB
https://drive.google.com/file/d/17VwUjuRfPLB-W0KXfy3djaeNOFBNMRe2/view?usp=sharing
https://www.engineeringtoolbox.com/rolling-friction-resistance-d_1303.html
https://www.engineeringtoolbox.com/drag-coefficient-d_627.html
Brother I need advice regarding, how you have extracted motor data. Please help me in this regard.
ReplyDeleteThe motor data was extracted considering the following:
Delete1) We know how a PMSM motor torque characteristic curve looks, it has a constant torque region and constant power region!!.
In ather 450X, the motor peak torque, peak power and rated power was known (from online source), and the top speed was also known from which I extracted the motor peak RPM (given the reduction ratio = 7.8, which was also from online source...) clubing it all is how I got the torque characteristics curve...
Resource 3: https://drive.google.com/file/d/17VwUjuRfPLB-W0KXfy3djaeNOFBNMRe2/view?usp=sharing
ReplyDeleteHi, great job. I just have one question, regenerative braking is not considered in this model, right?
ReplyDeleteThanks.
DeleteYes, regen is not considered.
Actually i wanted to learn how to design is there any video available so that i can learn it step by step
Delete